
The dashboard is the starting point for daily tenant operations. It summarizes current protection, investigations, and service health without replacing the detailed workflows in Detect, Protect, or Respond.
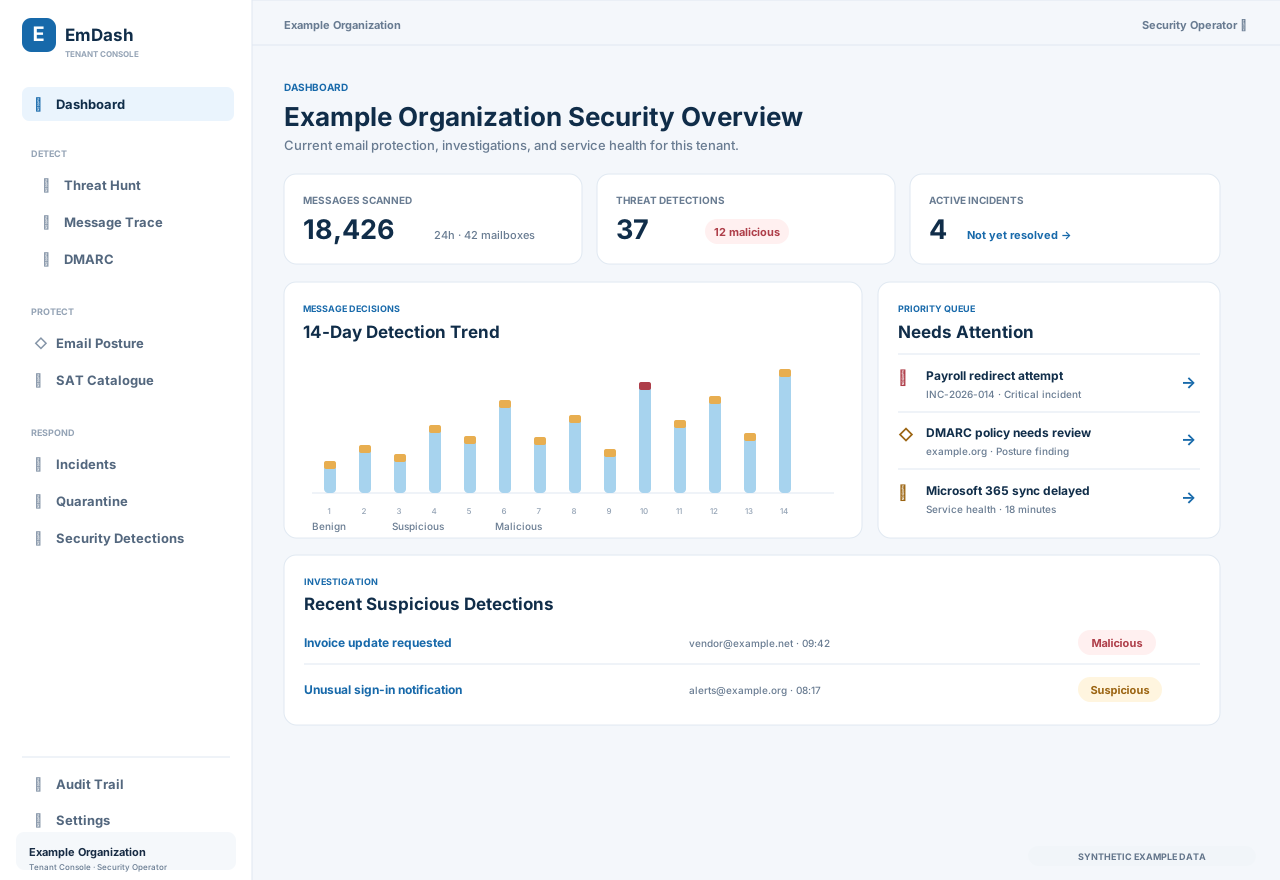
Summary cards
- Messages scanned shows the last 24 hours of message-processing volume and the number of protected mailboxes.
- Threat detections summarizes malicious and suspicious results from the last seven days.
- Active Incidents counts incidents that have not been resolved. Select the card to open the Active incident queue.
- Defender reports shows recent user-reported evidence when Defender is connected.
- Microsoft quarantine shows pending provider-reported actions where supported.
- DMARC alignment summarizes authentication reporting for the selected period.
Detection trend
The 14-day trend groups message decisions by day. Hover or focus a bar to read the benign, suspicious, and malicious counts. A missing trend does not necessarily indicate a problem; it may mean telemetry has not arrived or the tenant does not have ICES coverage.
Priority Queue
The queue highlights incidents, posture findings, and service failures that need attention. Each item links to its related incident, finding, or service detail so you can review the evidence and available next steps. The Active Incidents card opens the incident list with the Active queue selected; use Incident triage to search, filter, and page through that list.
Empty and unavailable states
“No data yet” means the source is connected but has not produced records. “Unavailable” means a provider, module, or assessment is not ready. Follow the action link in the card instead of repeatedly refreshing an unconfigured integration.